Reflectivity
/app/reflectivity
Pick one layer to inspect its slowness surfaces, or two adjacent layers to compute angle- and azimuth-dependent reflection coefficients at their interface and convolve them into a synthetic gather. Each layer uses a scenario from Rock Physics Modelling or its baseline properties, and the coefficients and gather are viewed on this screen as a quick check on the layer pair before the fuller Convolution or Wave Modelling.
Layer setup
Each selected layer has a card on the Setup tab. In Expert mode the elastic properties can be typed directly instead of taken from the layer's scenario.
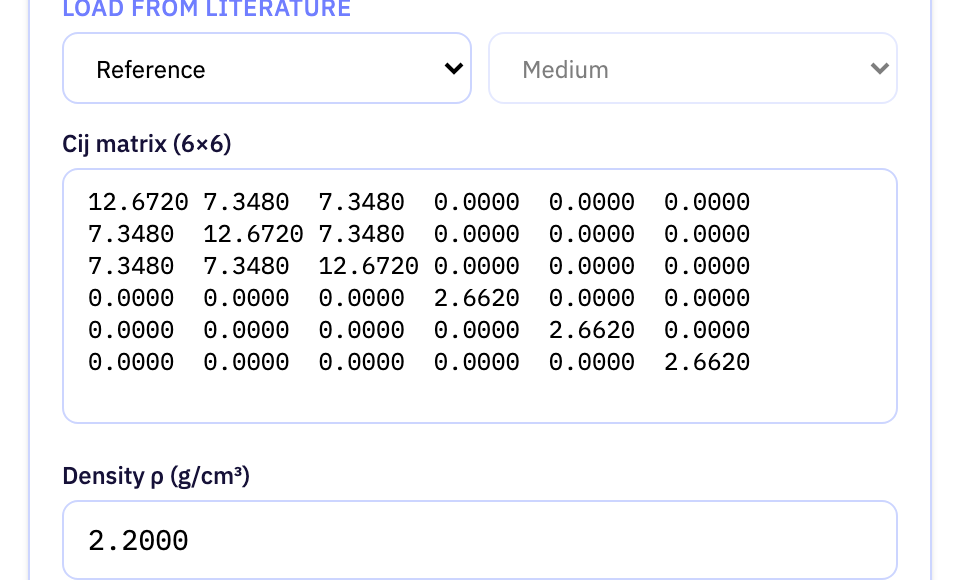
| Field | Purpose | Range | Default |
|---|---|---|---|
| Load from literature | A published source of measured anisotropic rock properties. Choosing one lists the media it reports. | — | — |
| Load from literature | One rock sample from the chosen reference. Selecting it fills the stiffness matrix and density with the published values. | — | — |
| Cij matrix (6×6) | The full elastic stiffness tensor of the layer, six rows of six coefficients. It sets how fast each wave type travels in each direction and therefore shapes the reflection response. | -2000 to 2000 GPa, 6 values | — |
| Density ρ | Bulk density of the layer. Together with the stiffness tensor it fixes the impedance contrast at the interface. | over 0, up to 6 g/cm^3 | 2.2000 g/cm^3 |
Limits are the API's unless marked app. The app may offer a narrower range.
Coefficients
Display controls for the Coefficients tab. They change what is plotted, not what is computed.

| Field | Purpose | Range | Default |
|---|---|---|---|
| P-wave | Which wave mode the single-layer diagnostics show: the compressional wave or one of the two shear waves. | — | P-wave |
| angle | The incidence angle at which reflectivity is plotted against azimuth. Drag it to walk through the computed angles. | — | — |
| azimuth | The azimuth at which reflectivity is plotted against incidence angle. Drag it to walk through the computed azimuths. | — | — |
| Tanaka contours | Draws contour lines with illuminated shading on the polar plot so peaks and troughs are easier to read. | — | false |
Limits are the API's unless marked app. The app may offer a narrower range.
Wavelet
The Ricker wavelet convolved with the reflection coefficients to build each synthetic gather.

| Field | Purpose | Range | Default |
|---|---|---|---|
| Frequency | Peak frequency of the Ricker wavelet. Higher frequencies give a sharper, thinner event on the gather. | over 0 Hz | 30 Hz |
| Phase * | Phase rotation applied to the wavelet. Zero gives a symmetric wavelet; other values skew the event shape. | -180 to 180 degrees | 0 deg |
| Sampling rate | Time step between samples in the synthetic trace. Smaller steps resolve finer detail at the cost of more samples. | over 0 s | 0.001 s |
Limits are the API's unless marked app. The app may offer a narrower range.
* Phase: the app shows unit deg; the API accepts unit degrees.
Gather slots
Choose which computed gathers to display. Two slots allow side-by-side comparison.

| Field | Purpose | Range | Default |
|---|---|---|---|
| Gather slot A | The gather shown in the viewer. Lists every coefficient set computed on the Coefficients tab. | — | — |
| Gather slot B | An optional second gather to compare against the first, side by side or as a difference. | — | — |
Limits are the API's unless marked app. The app may offer a narrower range.
Gather viewer
Display controls for the synthetic gather. They change how amplitudes are drawn, not the computed traces.

| Field | Purpose | Range | Default |
|---|---|---|---|
| Gain | How trace amplitudes are scaled before display: none, a time-power ramp, automatic gain control, per-trace normalisation, a fixed scale or a fixed bias. | — | None |
| p | Exponent of the time-power gain. Larger values boost later arrivals more strongly relative to early ones. | 0 to 5app | 2 |
| win | Length of the sliding window used by automatic gain control. Shorter windows equalise amplitudes more aggressively. | 0.01 to 2 sapp | 0.5 s |
| Gain | Constant multiplier applied to every sample when the fixed-scale gain is selected. | — | 2 |
| Gain | Constant added to every sample when the bias gain is selected, shifting the trace baseline. | — | 0 |
| Max Amplitude | Overrides the amplitude at which the display saturates. Leave it empty to clip at the percentile below. | — | — |
| Clip | Percentile of absolute amplitude used as the clip level. Lowering it makes weak events more visible and saturates strong ones. | 90 to 100 %app | 99 % |
Limits are the API's unless marked app. The app may offer a narrower range.